Add Data Charts to WordPress Form with RegistrationMagic
If you add data charts to WordPress form then you get to show any kind of graph on it. This not only proves the efficiency of your form but also conveys important data about your site to your users.
A Data Chart on your WordPress form can display statistics with graphs and charts. When you add data charts to WordPress Form it can also show your conversion percentage data; that is, how many users submitted the form in the past few days. The data charts can be pie charts or histograms that can add value to your form.
Your visitors will get to know the popularity and user strength of your business through the data chart in your form.
However, to add data charts to WordPress form, you need a WordPress registration page builder plugin. So that you can transform your default form to hold custom fields like data charts.
RegistrationMagic is one such plugin that can help you add custom user data fields and widgets to make your form a dynamic one. It has a wide spread of custom fields and widgets that you can easily add to your forms. And the Form Data Chart is such a custom widget of this plugin which you can display on your WordPress form.
The Fields of this plugin lets you gather user data on the form. While Widgets will help you display data on your form.
So, let’s go ahead and add data charts to WordPress form with the RegistrationMagic plugin.
Exploring Custom Fields and Widgets
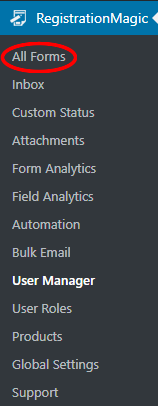
First, install the RegistrationMagic plugin and activate it. You will then find the plugin menu on your dashboard. From here, click on the All Forms link to land on the All Forms page.
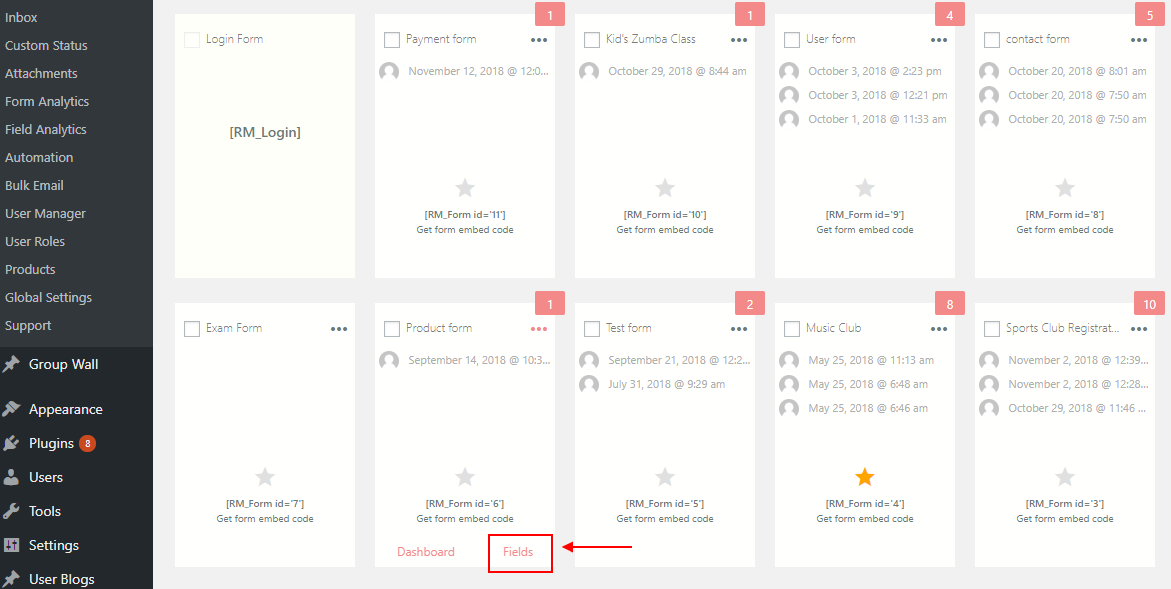
The All Forms page shows you all the forms that you create through this plugin. Now, as you hover your cursor over each form cover, you will find two links at the two bottom corners. These are Fields and Dashboard.
From the Dashboard link, you can take care of the WordPress form security, payments, design etc. While the Fields link will let you add and manage custom fields on your form. So, click on the Fields link to add data charts to WordPress form.
Now, you are on the Field Manager page. Here you will find all the forms that you will add to a certain form. All the fields that you add to each form stay unique to them.
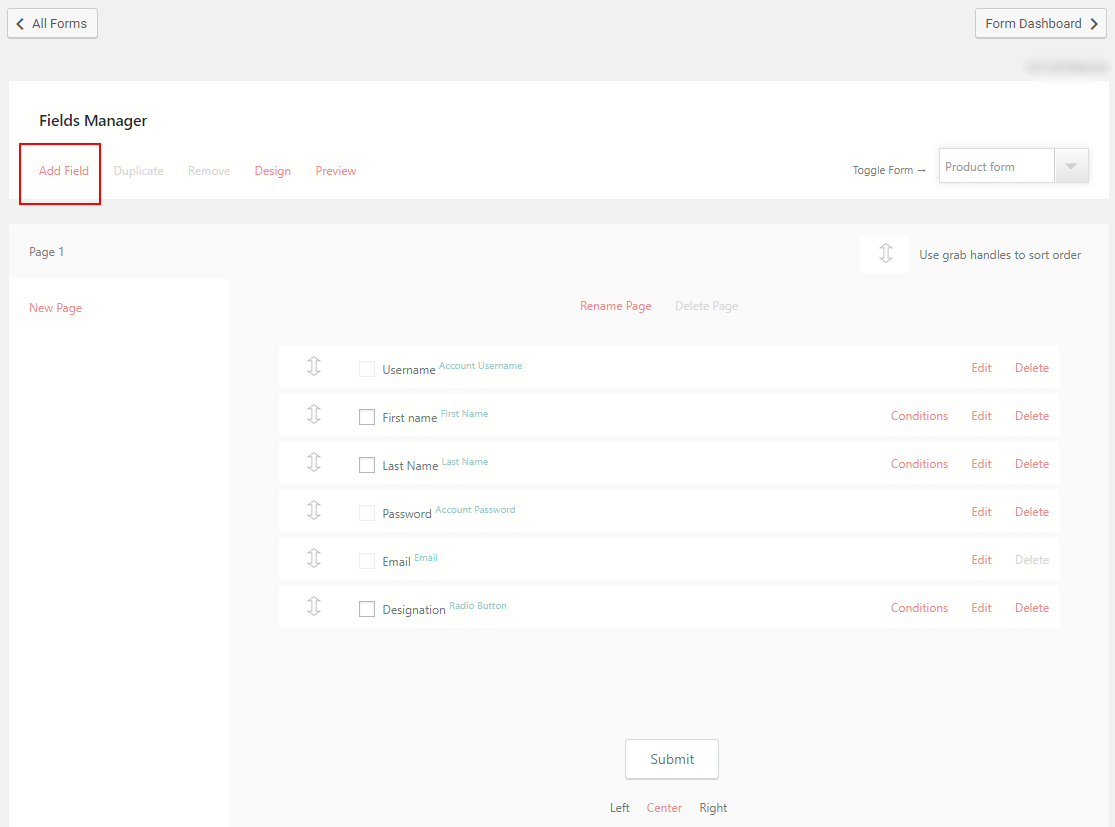
From here, click on the Add Fields link at the top left corner of the page. You will find a pop up opening up with all the preset fields and widgets of this plugin.
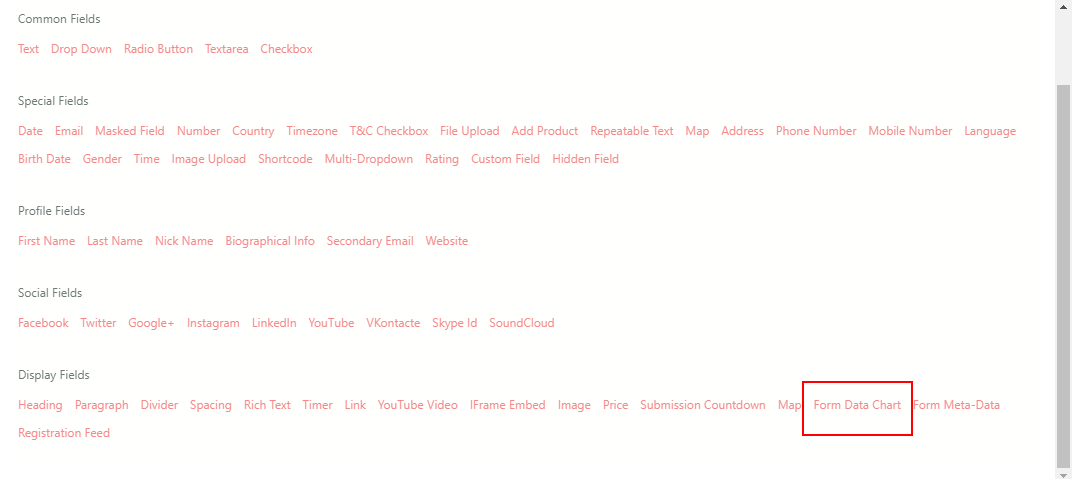
Now, from the pop up select the Form Data Chart widget under the Display Fields heading. The Display Fields offer widgets that can add to the visual elements of your form.
Setting up the Form Data Chart Widget
After clicking on the widget you will be land on the Form Data Chart settings page. You can control widget frontend design from this page.
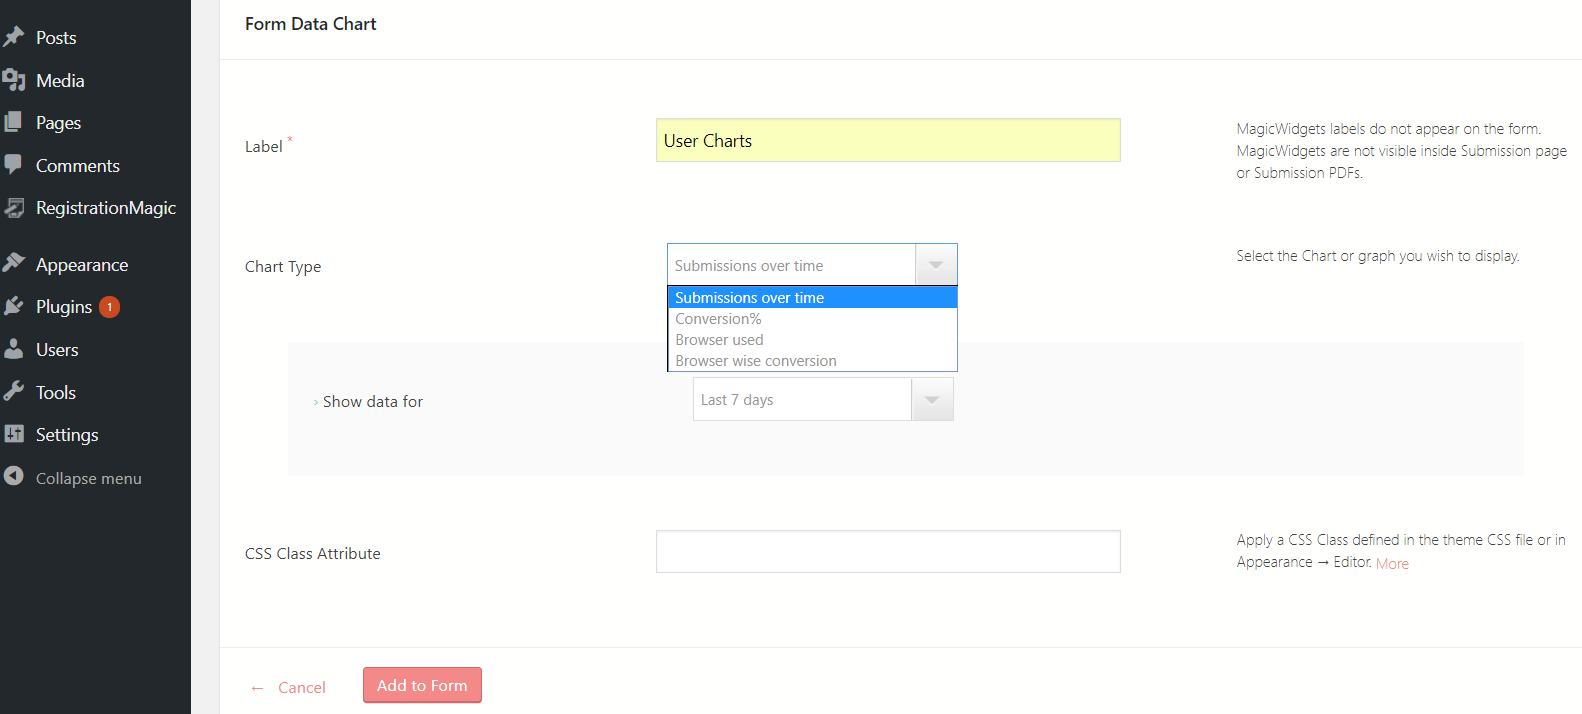
Fill the Label field with a text that will define the field on the form. I used User Charts. The Label name also appears beside the widget in the Field Manager page.
Next, go to the Chart Type setting drop down. From here, you can choose the type of graph you want to display in your WordPress form.
The options that you will find here are: submissions over time, conversion%, browser used and browser wise conversion. In our example, I chose to display the Submissions over time chart.
The next option lets you choose the timespan of the form submissions. From this drop-down, you can set the timespan value to last 7, 30, 60 or 90 days, as per your need.
Then the CSS setting modifies the frontend design. You can define the CSS class inside the coded file. Remember to associate the class with an HTML code.
Finally, click on Add to Form.
Data Chart on Frontend Form
Now, you just have to publish the form to view the form data chart on it.
RegistrationMagic makes it simple to display WordPress form with shortcodes.
On every form cover in the All forms page, you will find a unique shortcode.
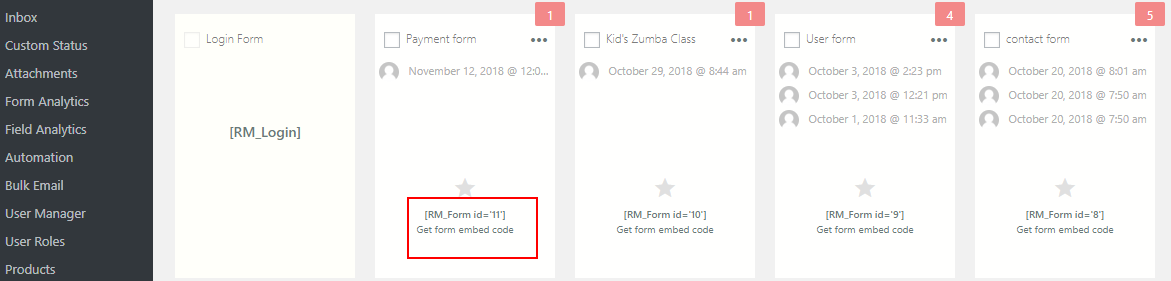
Copy the shortcode from form card. Paste it on a new WordPress page and click on Publish.
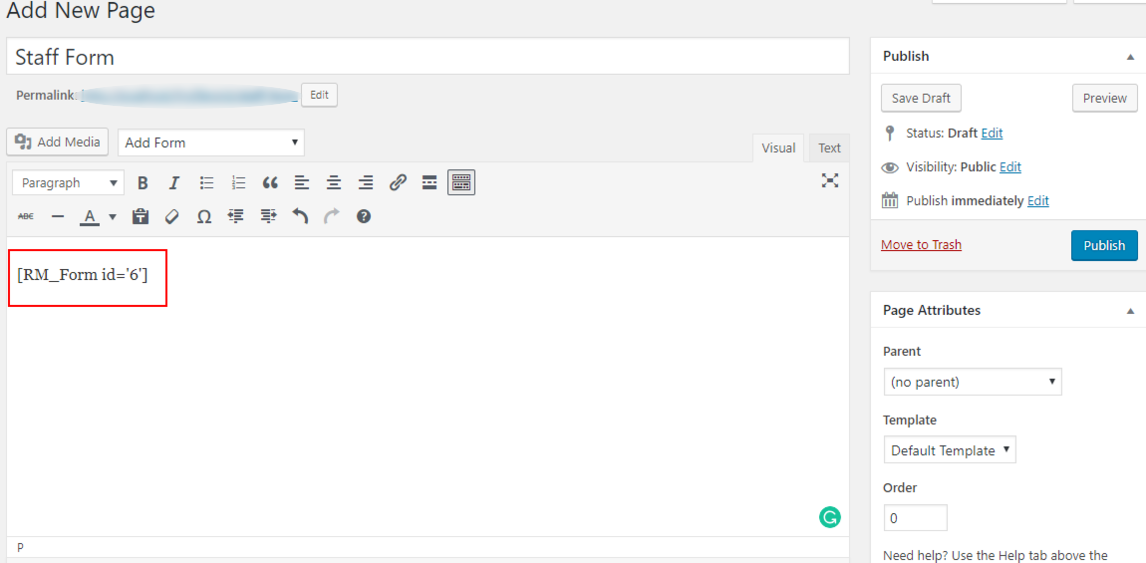
You will then find your WordPress form on your site.
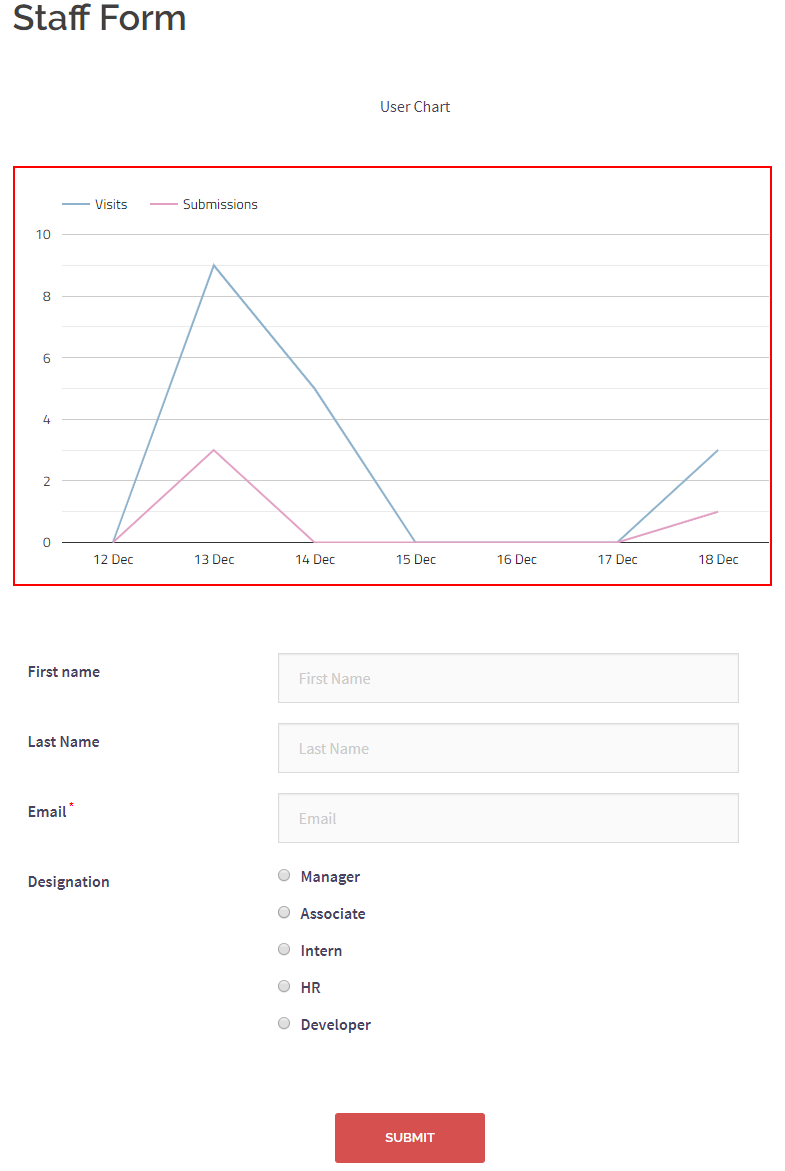
In the above form, you can see a User Data Chart with user visit and submission rate. There are two colored lines differentiating the two data fields, thus making the chart easy to interpret.
Usage of Data Charts on Forms
You can have several usages of a data chart on your form. For online marketing sites, it plays a special role in showing the number of users trusting on your site.
Also, for any class or event registration, you get to show the member strength on your event. Especially, for kids classes or camps. When parents see the number of conversions high in your camp or class registration form, they gain confidence to send their children there.
Then, if you own a blogging site or a membership site. Your user rate and conversion can play a crucial role in raising more user strength.
Besides by displaying the browser history and browser wise conversion, you get to prove the authenticity of your users.
And when you add data charts to WordPress form with RegistrationMagic, you are in for more. You can apply as many charts as you want on your form. Also, you can place the widget wherever you want. Just drag and drop the widget from the Field Manager page with the two-headed arrow handler.
So, you see this plugin can make your form efficient enough for any industry need. You can add products, price, map locations and many more fields on your default form.
So, boost your site with the RegistrationMagic plugin and with no coding or designing, create a form for professional usage.
- Complete Automation Guide for WordPress Forms - July 20, 2024
- WordPress User Management Plugin Guide - July 18, 2024
- Add CAPTCHA in WordPress Login and Registration Form? - July 16, 2024
- How to Send Automated Welcome Emails in WordPress - July 15, 2024
- WordPress User Roles, Permissions & Role Editor [Complete Guide] - July 14, 2024
- How to Display Custom Success Message in WordPress Forms - July 12, 2024
- Publish Registration Forms and Display Registered Users - July 11, 2024
- How to Approve WordPress User Accounts Without Logging Into Dashboard - January 25, 2021
- How to Set up Two Factor Authentication in WordPress - April 4, 2019
- How to Edit or Replace Default WordPress Registration Form - April 2, 2019